
摘要: This article will explain the basics of how to analyze time series data using crude oil price data.
In recent years, inflation has accelerated in the United States. In particular, the price of crude oil has skyrocketed due to the war, and many people are anxious about the future course of the oil market. This article will explain the basics of how to analyze time series data using crude oil price data.
Throughout this article you will learn
- the basics of how to analyze time-series data.
- how crude oil prices have been changing
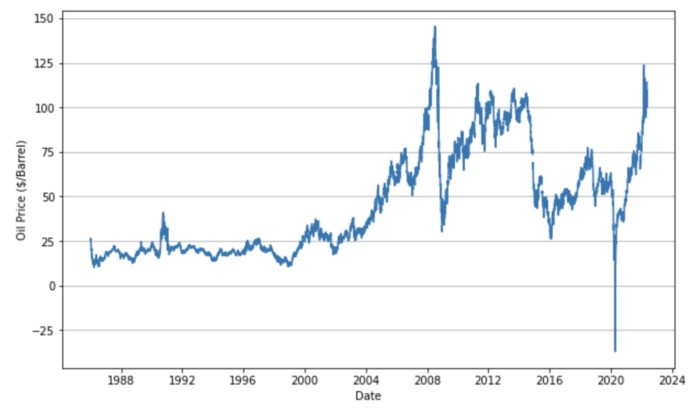
Crude Oil Prices: West Texas Intermediate (WTI) — Cushing, Oklahoma (DCOILWTICO)
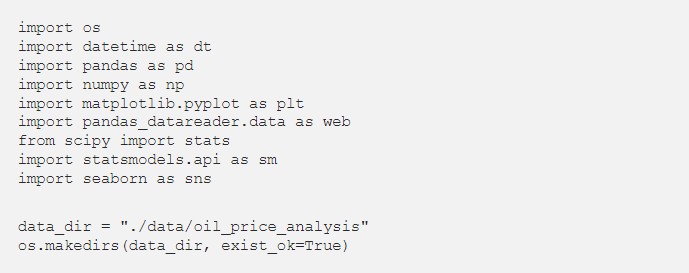
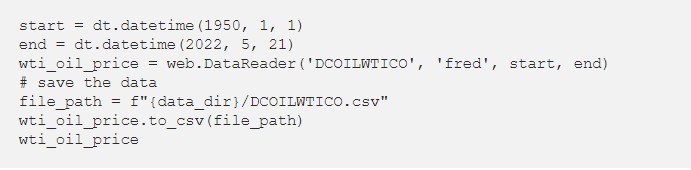
WTI is one of the leading oil price indices due to the large volume of transactions and market participants. We will download the data for the entire period available and use it for analysis.
Reference:
U.S. Energy Information Administration, Crude Oil Prices: West Texas Intermediate (WTI) — Cushing, Oklahoma [DCOILWTICO], retrieved from FRED, Federal Reserve Bank of St. Louis; https://fred.stlouisfed.org/series/DCOILWTICO, May 20, 2022.
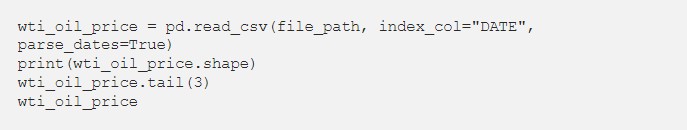
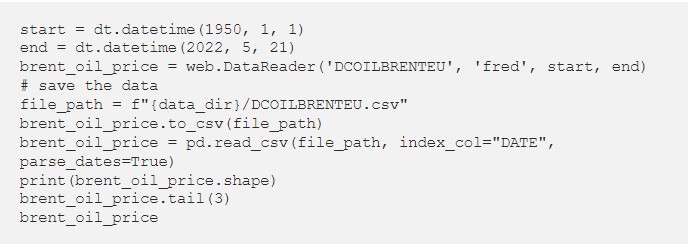
When dealing with time series data, it is important to handle time information. Time information is often set to an index. In the following code, time information is set to the index when reading a csv file.
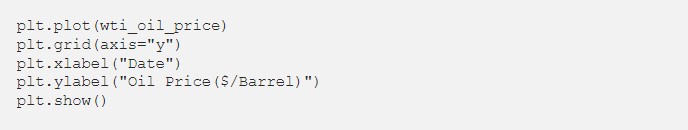
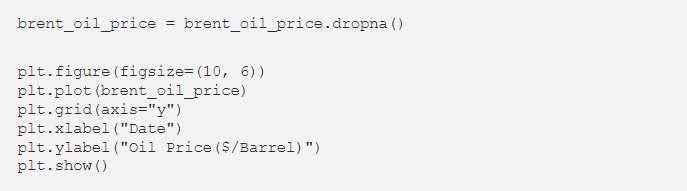
We will draw a time-series plot to see how oil price have changed.
Data Extraction with Datetime Index
Since time information is set to an index, it is easy to extract data by specifying the time. There are several ways to extract time-specified data, one of which is to specify the time in the form of a string.
Let’s extract data for April 20, when the oil price was negative.

A colon can be used to specify a range of time.

You can also specify the data in Datetime format.

You can also specify the month or year.

Crude Oil Prices: Brent — Europe (DCOILBRENTEU)
Another commonly used crude oil price indicator is the Brent crude oil price. In the following, we will use this data where the price is not negative. We will download the data for the entire period available and use it for analysis.
Reference:
U.S. Energy Information Administration, Crude Oil Prices: Brent — Europe [DCOILBRENTEU], retrieved from FRED, Federal Reserve Bank of St. Louis; https://fred.stlouisfed.org/series/DCOILBRENTEU, May 20, 2022.
Let us illustrate the transition of crude oil prices again.
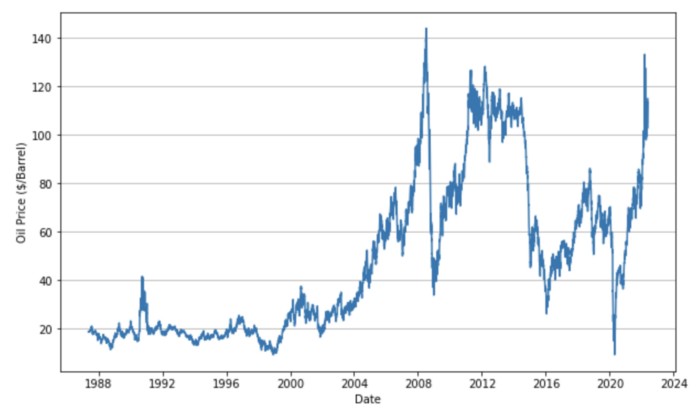
The highest crude oil price was $143.95 per barrel on July 3, 2008. The price then fell sharply due to the recession, but rose again to reach $120 per barrel in April 2011.
During the recession caused by the pandemic of the new coronavirus, the price of crude oil dropped to $9.12 on April 21, 2020. Subsequently, monetary easing and the effects of the war caused oil prices to soar. The highest oil price this year was $133.18 on March 8.
As you can see, the price of crude oil is very volatile and it is difficult to say that there is a long-term trend.
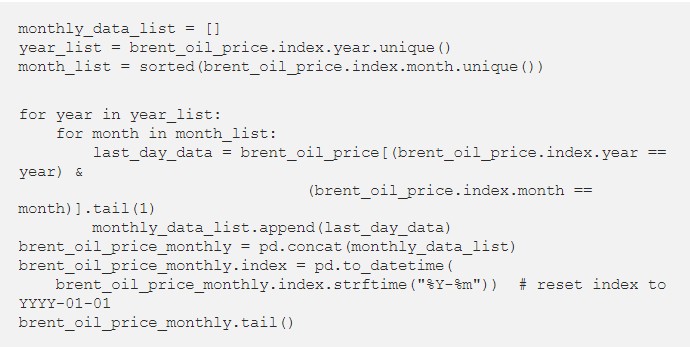
Resampling
The data now is daily data, but data is not available every day. Also, there are more than 30 years of data, so it takes a lot of computation. So, in order to solve those problems, we will convert the data to monthly data. Here, the price on the last trading day of each month is treated as the price for that month.
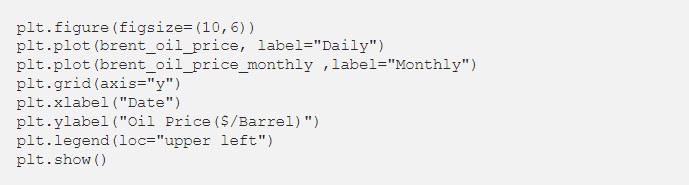
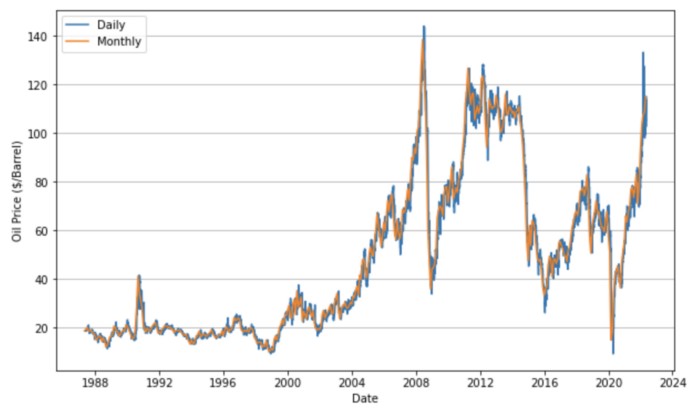
Draw a graph to confirm that although the number of data has decreased significantly, the trend of the time-series data has not changed.
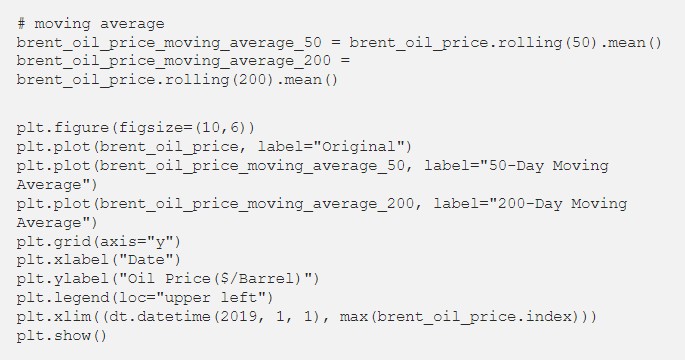
Moving Average
Moving averages are also useful for capturing broad trends. Moving averages calculate the average of the n most recent data, rather than the average of all data. By moving the window in which the average is calculated, the time-series data can be smoothed out.
Moving averages can be calculated using the pandas rolling method.
Here we will calculate and plot the 50-day and 200-day moving averages.
Excellent! You can see that the fluctuations that were so drastic in the daily data are now smoothing out.
Differencing
Differencing is often useful with time series data. This is because differencing can have tractable properties such as stationarity. Let’s actually take the difference and see how the data changes.
The calculation itself can be easily done using the shift method of pandas. In this example, we will calculate the difference from the value one month ago.

The same can be done using the diff method of pandas.

Now let’s plot the difference.
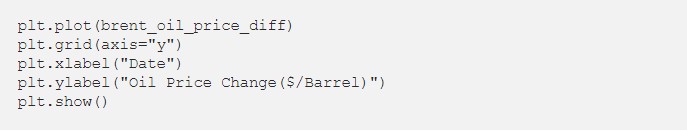
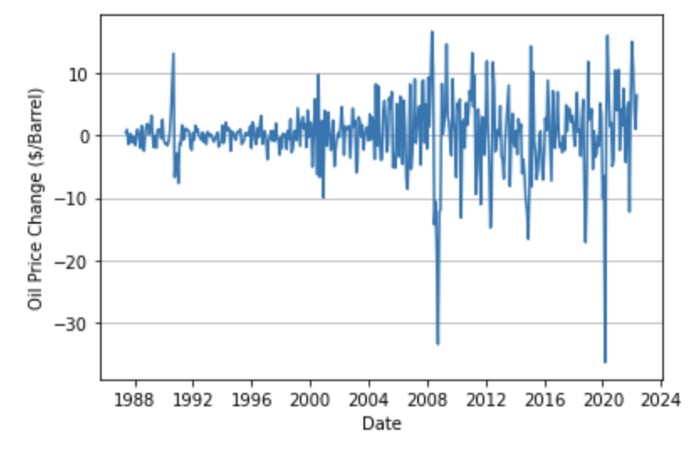
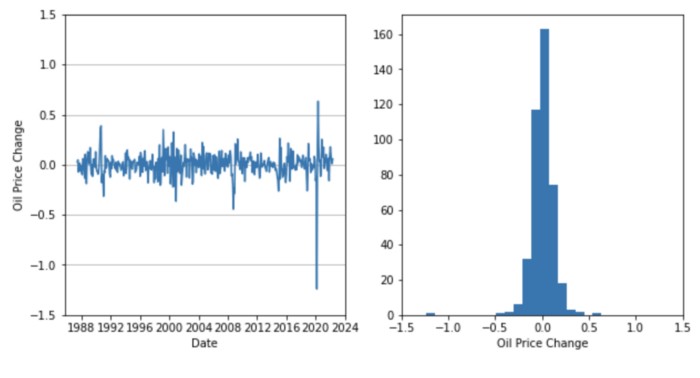
You can see that the data fluctuates up and down around 0. The original series fluctuated irregularly, but after the difference is taken, the fluctuation is relatively clear.
Let’s check the histogram to see if the data is actually distributed around 0.
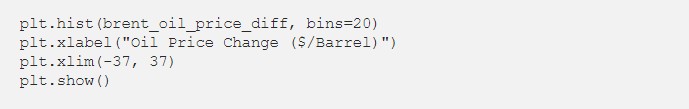
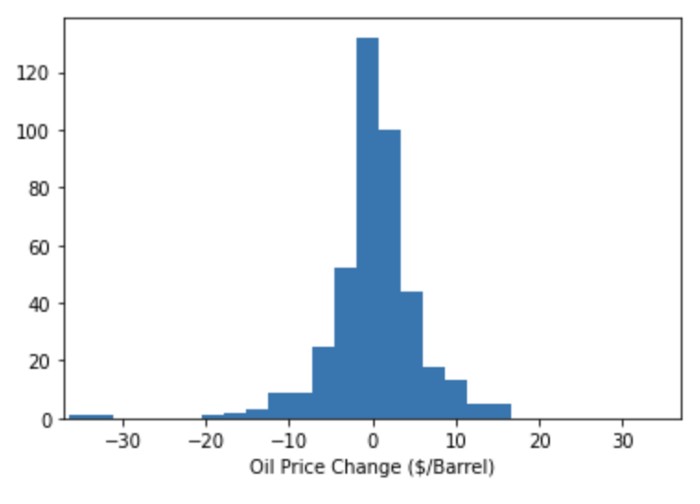
It is amazing! The data is distributed around 0, and it has a beautiful mountain shape.
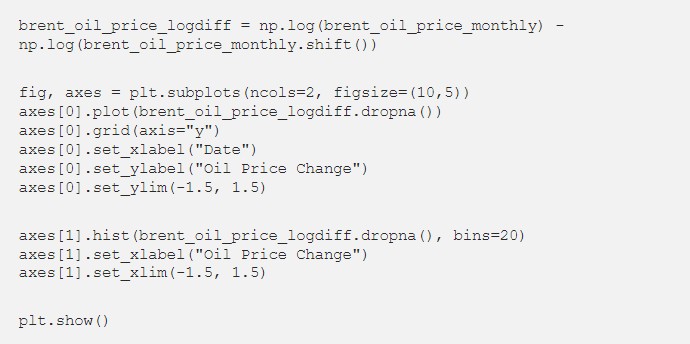
Also, in time series analysis, logarithmic differences are often taken. The logarithmic difference is an approximate measure of the “rate of change”. Logarithmic also has the advantage of making it easier to fit the data to the model.
Autocorrelation
The main feature of time series data is that they are autocorrelated. Since time series data are obtained by following the same variables over time, data that are close in time tend to have similar values.
For example, a positive autocorrelation indicates that if the price of crude oil was high yesterday, it will be high today as well. A negative autocorrelation would indicate the opposite.
However, autocorrelation alone can be somewhat difficult to interpret. This is because there is a possibility that the effect of indirect autocorrelation is included. For example, if yesterday and today are similar and the day before yesterday and yesterday are similar, are the day before yesterday and today similar or not so similar? It is a little difficult to tell.
In such cases, partial autocorrelation is effective. Partial autocorrelation allows us to calculate the autocorrelation only for a specific day, ignoring other days.
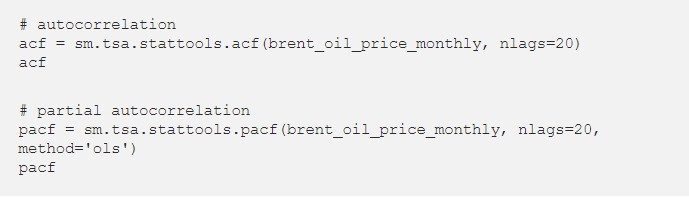
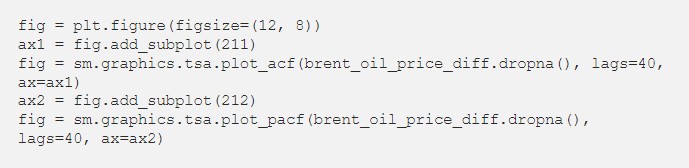
Using statsmodels, we can calculate autocorrelation and partial autocorrelation as follows
Let’s graph autocorrelation. The horizontal axis shows the lag and the vertical axis shows the value of the autocorrelation. This graph is called a correlogram.
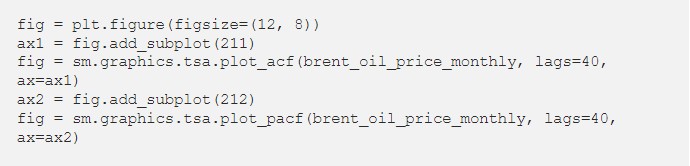
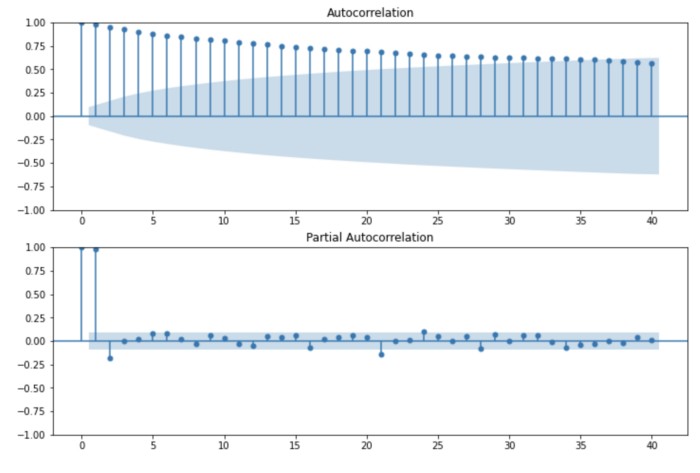
The area shaded in blue shows the 95% confidence interval for the null hypothesis that the autocorrelation is zero. If there are points outside this interval, we can say that there is significant autocorrelation.
In the oil price data, we see that the autocorrelation is very strong. On the other hand, when we look at partial autocorrelation, we find that the correlation with the values of one or two months ago is large, while there is almost no correlation with the other values.
Finally, we will draw a correlogram for the difference series.
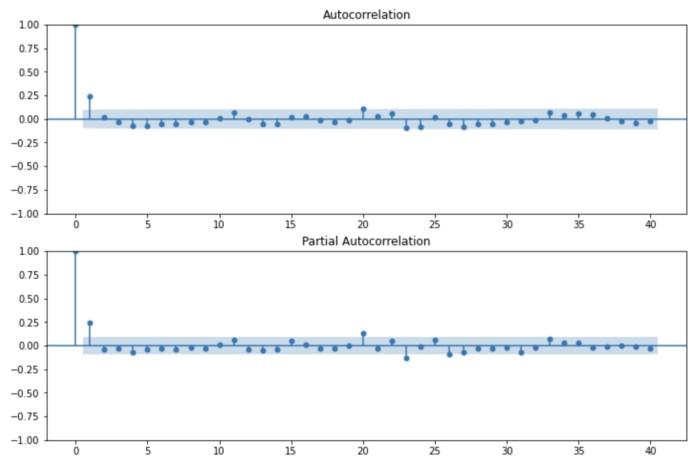
The autocorrelations are much smaller, with only first-order autocorrelations.
Conclusion
In this article, we looked in detail at the handling of time series data and the characteristics of the data. I recommend that you try to study them while actually writing the code.
轉貼自Source: medium.com
若喜歡本文,請關注我們的臉書 Please Like our Facebook Page: Big Data In Finance

留下你的回應
以訪客張貼回應