
摘要: Using DStack for Creating Interactive Webapps Effortlessly
▲來源:By Author
Data Visualization is one of the important aspects to understand what the data is all about. It uncovers any hidden patterns or associations between the data points. There are different Python libraries that can be used for visualization but wouldn’t it be interesting if we can create a web app that shows a visualization of different data points and contains different widgets like a dropdown list, checkbox, etc.
Similarly, creating a Machine Learning model and using it in web applications for generating predictions can be useful, but is generally a little difficult. Wouldn’t it be great if we can develop ML models and use them in web apps easily?
DStack is an open-source Python library that is used for building web applications not only for data visualization but also for Machine Learning experimentation. It allows us to create web applications with minimal coding and is easy to use.
In this article, we will explore DStack and create a basic application for Data Visualization and also show you how to push a Machine Learning model to DStack.
Let’s get started…
Installing required libraries
We will start by installing DStack using pip installation. The command given below will install DStack using pip.

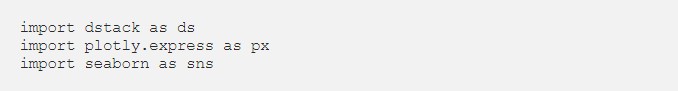
Importing required libraries
In this step, we will import all the libraries that are required for loading a dataset, creating data visualization, and creating a web app for these visualization using DStack.
Loading Dataset & Creating Visualizations
Before creating the visualizations we need to create an instance of the application under which we will write all the code. Here we will write the code for loading the data, creating a visualization, and rendering them in the web application.
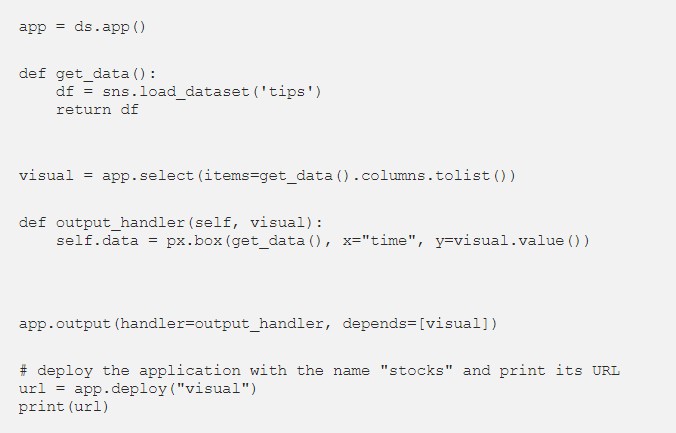
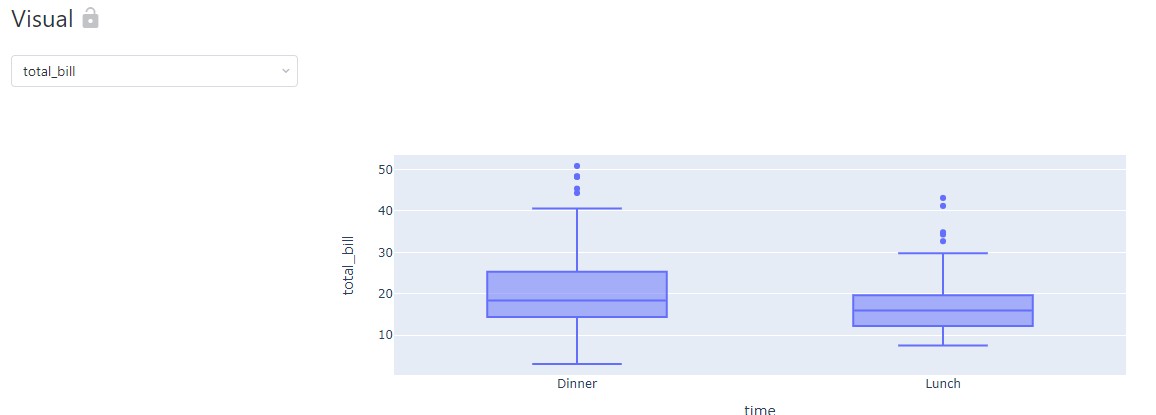
As soon as we run this code the application will be rendered at the URL printed as the output. The application home page is given below.
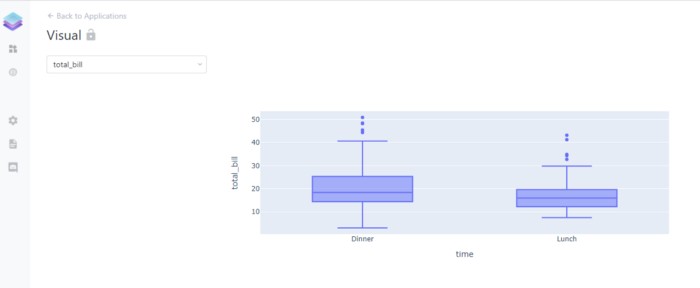
▲Web Application(來源:By Author)
Here in this web application, we can clearly see the Box Plots that we have created in the code above and the drop-down list to select different columns to create their box plots.
Go ahead try this with different datasets and create different visualizations and let me know your comments in the response section.
This article is in collaboration with Piyush Ingale .
轉貼自Source: towardsdatascience.com
若喜歡本文,請關注我們的臉書 Please Like our Facebook Page: Big Data In Finance

留下你的回應
以訪客張貼回應