
摘要: Exploring some interesting visualization with its code, advantages and limitations.
▲來源:https://bigdata-madesimple.com/
Overview:
Not everyone is a data scientist!
People often get bored seeing numbers while pictures are always exciting to look at.
Gaining insights is not easy just by looking at the data, also as said not everyone is a data scientist who can throw queries and find answers. Visualization can help you find answers that are not obvious from viewing the raw data.
Definition:
Visualization can be defined as representing data in a more understandable way using graphs and charts. Any graphical presentation that conveys some useful information or insight can be thought of as Visualization. Visualization has evolved from cave drawings and thematic cartography of 17th century to modern interactive 3-D plots.
In this data-driven world where information persists everywhere from a car sensor to remote satellites, representation of information in proper form is a crucial task. Visualization serves this need!
Visualization gives you answers to questions you didn’t know you had.” — Ben Schneiderman
Importance/Usefulness:
- Visualization is actively used in making business decisions by identifying the patterns and extracting useful information
- Presenting information to non-technical personality
- To get an overview or summary of the data
- Useful in performing analysis and machine learning tasks
- Extract trends and outliers
Visualization can range from a simple sketch on a paper to some complex graphs generated using visualization libraries. Visualization is an effective medium to convey messages until they are correctly represented. Bad visualizations can communicate a whole different meaning and may have negative consequences.
● ● ●
In this article, we have mentioned some of the unique visualizations along with their applications and limitations. The article illustrates various visualizations along with its code. Some of the libraries we have used are Matplotlib, Plotly and Seaborn
Here are some interesting visualization along with the insights drawn from them:
1. Nightingale Rose Chart:
Nightingale rose chart was first created by Florence Nightingale in 1858 representing “Diagram of the causes of mortality in the army of the East”. It is also known as Coxcomb Chart or Plot Area Diagram. It can be seen as an upgrade over Stacked Column Chart which contains stacked column along with the radars.
Use cases:
This chart is widely used when showing distribution over time. It is often used to represent wind speed and directions.
Limitations:
Nightingale chart proves to be less useful when large number of features are to be plotted. The stacked portion might become crowded and hard to interpret when many categories are added.
▲Nightingale Rose Chart(來源:medium.com)
Insights:
The above chart shows the number of goals scored by players during 2014 and 2018 FIFA World cup. Here the years 2014 and 2018 are taken as categories and are represented using stacked slices and the scales shows the number of goals scored.
2. Sankey Diagram:
Sankey Diagram shows flow from one quantity to other quantities along with their proportion. During each stage of a process, arrows can combine or split the path. The width of the arrow shows its value, hence wider the arrow larger the proportion.
Use cases:
It can be used in finance, management and energy analysis or to represent a life cycle of a product. This type of visualization can be used to describe the flow of an entity from source to end. For example, if we want to know how much a product is produced, reused, wasted over a period of time.
Limitations:
Sankey diagrams are limited to flows and life cycles. It has limited representation like nodes, connections and the values. More complex relationships cannot be derived from it.

▲Sankey Diagram(來源:medium.com)
Insights:
The above diagram shows the sources of electricity generation in 2018. It is seen that the contribution of coal was the highest followed by gas and reducing down to oil which contributed the least.
3. Sunburst:
Sunburst is an alternate of Treemap to represent hierarchical data but in a circular form. As the name suggests bursting of the sun ? the hierarchy moves from the inner circle to outer. Each category of the circle is sliced as a node and the center of the circle is the root node. It’s better to represent a particular hierarchy with different shades of a color to maintain uniformity.
Use cases:
Sunburst can show hierarchical flow as well as part of a whole relationship
Limitations:
If the color scheme is improper then understanding the chart becomes difficult. Further, too much slicing makes chart crowded and hard to read.
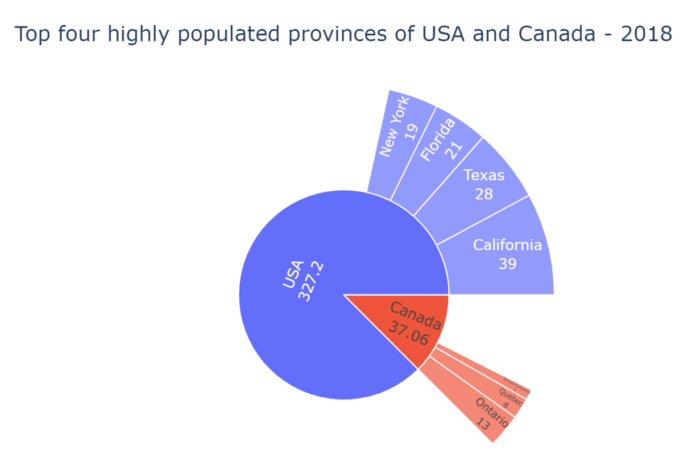
▲Sunburst Chart(來源:medium.com)
Insights:
It is seen that California has the maximum population of 36M in the US and Ontario has a maximum population of 13M in Canada. Total population of the US and Canada from all these 4 provinces are 327.2M and 37.06M respectively
4. Bubble Chart:
You can say Bubble Chart is a sibling ? of Scatter Plot but with some difference. Bubble chart and scatter plot both use x and y-axis but the bubble chart also includes a 3rd dimension i.e. z-axis which represents the size of the bubble. You can also include a 4th dimension here by coloring the bubbles. While making a bubble chart make sure that the size of the bubble is relevant to its corresponding value.
Use cases:
A bubble chart is generally used to represent the relationship between three or four features.
Limitations:
If you have large data than bubble chart would look more like a mess as bubbles would overlap and it becomes difficult to interpret. Also, if the variable representing the bubble size is zero or negative than this chart does not prove useful.
▲Bubble Chart(來源:medium.com)
Insights:
Here Kellogg’s health type cereal got the highest rating of 93 and Quaker’s kids type cereal has the lowest rating of 21.
5. Funnel Chart :
Funnel chart represents each stage of a process. It shows the decrease in values at each stage. Here starting phase is largest and then the size of the bar keeps on decreasing at each stage, hence taking shape of a funnel. The reduction in value can easily be compared with the above values.
Use cases:
It can be used in finance or business sector. E.g. Process of sales flow in a company or activities of a customer visiting an e-commerce website. It shows a complete summary of each stage of a process and can be used to make important decisions. Also, funnel charts are intuitive and easy to understand.
Limitations:
Funnel are simple structures and are inefficient in representing complex relationships among features.
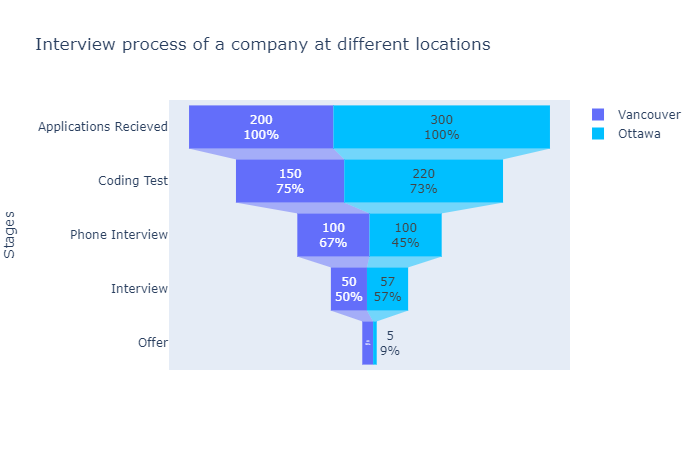
▲Funnel Chart(來源:medium.com)
Insights:
Initially, Vancouver and Ottawa both received 200 and 300 applications respectively. The candidates got refined as the process continued. Only 50 and 57 candidates were selected for the final round of interviews at the respective offices and from them, 15 candidates received offer for Vancouver office and 5 candidates got in the Ottawa office.
6. Ridgeline plot/ Joy plot:
Ridgeline Plot, which was formerly known as joyplot is a useful visualization which helps us to understand the distribution of data. Distribution of various features can be examined at the same time using this plot. Here the features can also be grouped on a particular column.
Use cases:
Ridgeline plots are very intuitive and are used widely for pre-processing tasks. It works well for comparing a small number of features.
Limitations:
It might not be useful for comparing a large number of features as it may mess up the graph. Also overlapping of the curve might be difficult to view.
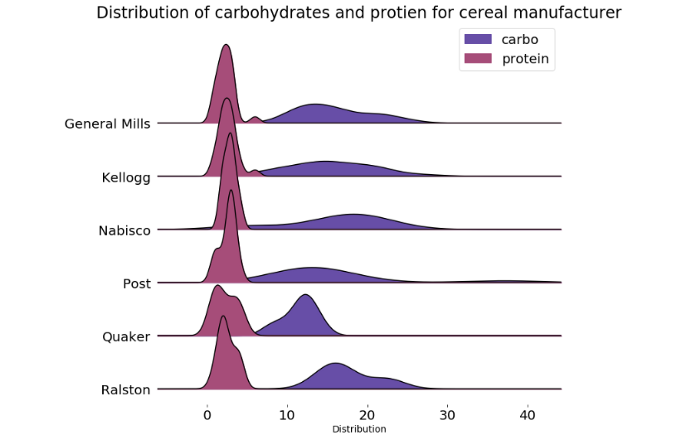
▲Ridgeline Plot(來源:medium.com)
Insights:
From the above plot, we can see the distribution of values for the carbohydrate and protein content for different cereal manufacturers. It is seen that the values of protein are normally distributed.
7. Tree Map:
If you want to represent hierarchical data than tree map can come handy. In the tree map, each hierarchy is represented in the form of rectangles. Each rectangle represents two values, one is quantitative value and the other is the label. The size of the rectangle is in proportion with its own quantitative value as well as it’s parent’s value. The parent value is total of all its child values. If the parent has no quantitative value than all children are equally divided within the parent.
Use Cases:
It is best to represent hierarchical data. It is used when we want to compare the proportion of different categories.
Limitations:
It is not useful if there is a high hierarchy as the tree map becomes clustered and it is difficult to understand. Also, the rectangles are aligned automatically and you don’t have control over it. It can not be used to represent negative values.
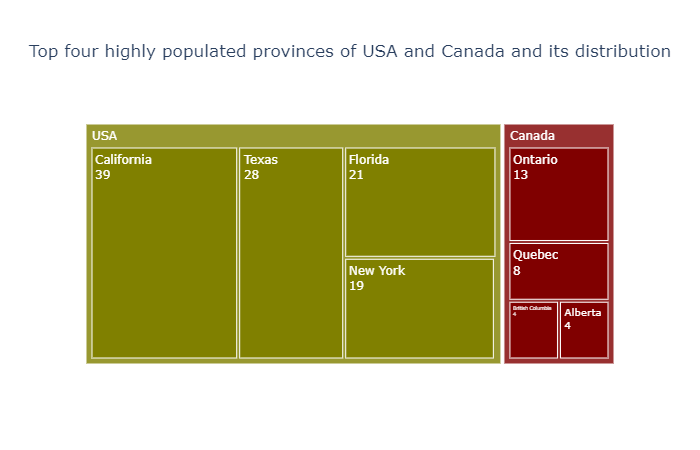
▲Treemap(來源:medium.com)
Insights:
California has a maximum population of 36M in the US and Ontario has a maximum population of 13M in Canada. The total population of the US and Canada from all these 4 provinces are 327.2M and 37M respectively.
8. Waffle Chart:
Waffle charts are used to show the contributions of the features. The proportion of a feature is represented using square blocks which overall forms a waffle-like structure. It is used to compare the proportion of different categories
Use Cases:
It represents proportions in a well-defined color grid format which is easy to view and understand. They are used to understand how much a category or feature contributes to the whole.
Limitations:
It cannot give any more information except the proportion of different categories
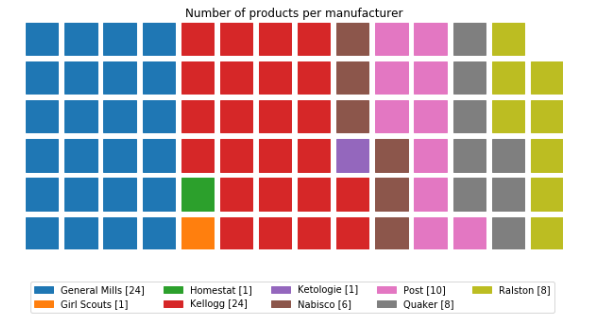
▲Waffle Chart(來源:medium.com)
Insights:
The given graph shows the number of products per manufacturer. It is seen that General Mills and Kellogg has the highest number of products i.e. 24
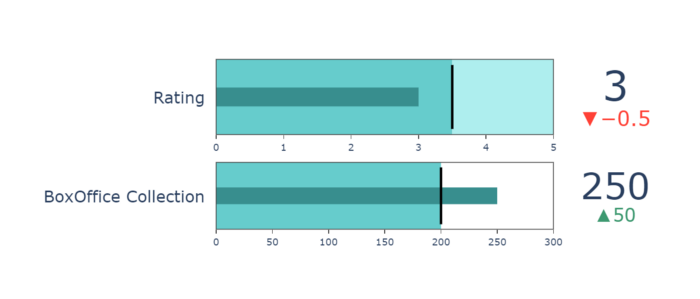
9. Bullet Chart:
Bullet chart is used if you want to compare a value with a target value and want to know whether the obtained value is good or bad. It can be used as an alternative to gauge and meter chart.
Use Cases:
It is used in Business, Finance or Management sector. For e.x. If you want to know whether the total sales surpassed the targeted value.
Limitations:
Sometimes it takes time to understand and plot the chart with coding. Also, only one value can be compared at a time.
▲Bullet Chart(來源:medium.com)
Insights:
The first bullet chart shows that a movie got a 3-star rating compared to 3.5. From the second chart, it is seen that the movie collected 50 million more money than the threshold value. Hence movie did great in terms of earning and but not with critic reviews.
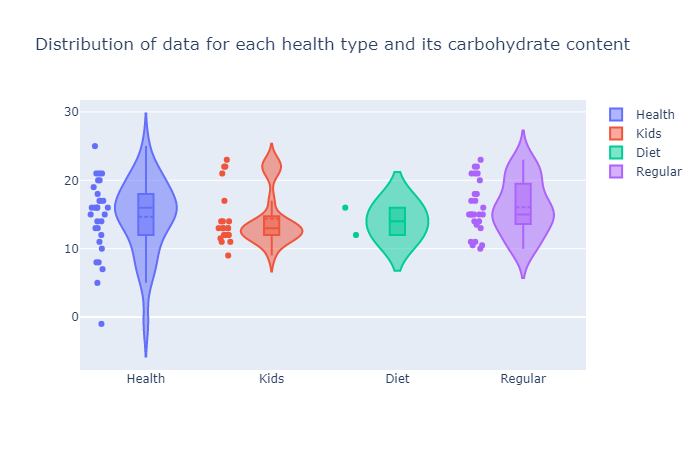
10. Violin Chart:
We know that the box plot shows data properties like minimum, maximum, median, first quartile and third quartile but it fails to show actual distribution of data. This distribution of data can be shown through a density plot. What if we can represent these two chats in one? Yes, we can ? through violin chart. It represents the distribution of data along with box plot attributes.
Use Cases:
It can be used in any field where you want to show the distribution of data along with the statistical insights.
Limitations:
It might seem congested for a large number of features as the statistical information along with the distribution curve needs to be shown.
▲Violin Chart(來源:medium.com)
Insights:
It can be seen that health, diet and regular type has a normal distribution and kids type has an uneven distribution of data. Also, there is a negative value in health type which is an outlier as carbohydrate value can not be negative.
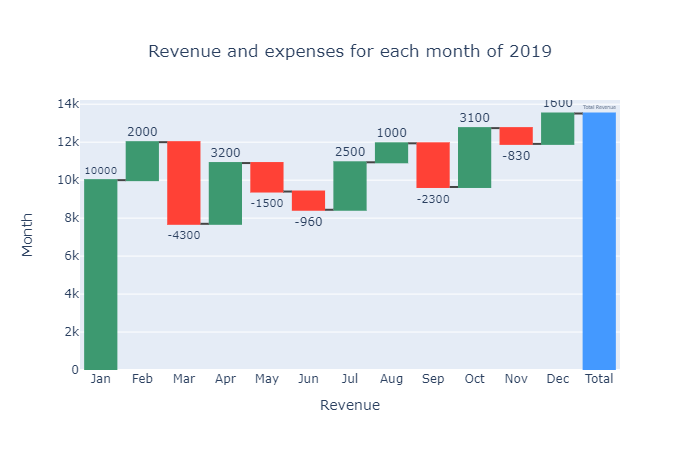
11. Waterfall Chart:
If you want to visualize how a value is reached by doing a number of addition and subtraction operation on an initial value then the waterfall chart fits perfectly. In Waterfall chart colors are used to show different operation e.g. green shows addition, red shows subtraction and blue shows total value received after all the operations. Here all the values between starting and final value are floating, thus the name waterfall chart.
Use Cases:
This chart is commonly used in the business and finance sector. For e.g. how revenue flowed over the months or how stock prices changed over a period of time.
Limitations:
Only the flow of process can be represented using this chart.
▲Waterfall Chart(來源:medium.com)
Insights:
It is seen that the highest revenue was gained in January (10K), while the maximum expenses were seen in March. The total revenue earned at the end of the year was 13.51K.
● ● ●
Article By: Miral Raval, Tirth Patel, Utsav Maniar
詳細程式碼,請見: medium.com
轉貼自Source: medium.com
若喜歡本文,請關注我們的臉書 Please Like our Facebook Page: Big Data In Finance

留下你的回應
以訪客張貼回應